Release Highlights
The OpenMLDB community has just released a new version of OpenMLDB v0.8.4, The main highlights are as follows:
- A major update on the diagnostic tool that provides more comprehensive reports for troubleshooting OpenMLDB cluster deployment issues, significantly boosting operational efficiency.
- Support for compression in online data tables, which can reduce memory usage by approximately half. However, this may introduce some performance overhead (within a factor of up to 2). Users can flexibly choose whether to enable data compression based on performance and cost requirements.
- Optimized insertion performance for online data tables, reducing latency by about 30%.
- The addition of SQL syntax SHOW CREATE TABLE, allowing users to conveniently view the creation statement of existing tables.
- The addition of SQL command TRUNCATE TABLE, making it more convenient to clear the data from an entire table.
- Improvement in the monitoring module, enhancing the accuracy of latency metrics.
- Support for ZooKeeper authentication functionality.
- Upgrade of brpc to version 1.6.0. For detailed release notes, please refer to: https://github.com/4paradigm/OpenMLDB/releases/tag/v0.8.4
Feel free to try it out, and discuss it in the official Slack channel (https://join.slack.com/t/openmldb/shared_invite/zt-ozu3llie-K~hn9Ss1GZcFW2~K_L5sMg) if you have any thoughts on improvements or questions!
Upgraded Diagnostic Tool
In the new v0.8.4 version, one of the key highlights, as mentioned above, is that we have comprehensively upgraded the diagnostic tool to provide a more complete and intelligent diagnostic report, which assists in efficiently identifying issues within the OpenMLDB cluster and significantly enhances operational efficiency.
Compared to the previous versions, the new diagnostic tool introduces a one-click diagnostic feature. By using openmldb_tool inspect, you can diagnose the health status of the cluster with a single click. The information provided includes two sections: XX Detail and Summary & Hint.
The XX Detail section offers current cluster status information, while the Summary & Hint section highlights the key areas requiring attention. It suggests potential problems and corresponding resolutions to help users perform cluster repairs. In most cases, the information in the Summary & Hint section is sufficient for users to address cluster issues. For more complex situations, users can refer to the current status information in the XX Detail section for handling or provide the report to us for faster identification of problems and guidance for repair. For specific details about the diagnostic tool, please refer to the official documentation (https://openmldb.ai/docs/en/main/maintain/diagnose.html).
Next, we will briefly demonstrate how to use the one-click diagnostic feature to view the cluster status and quickly resolve common issues.
Demo and Report Reading
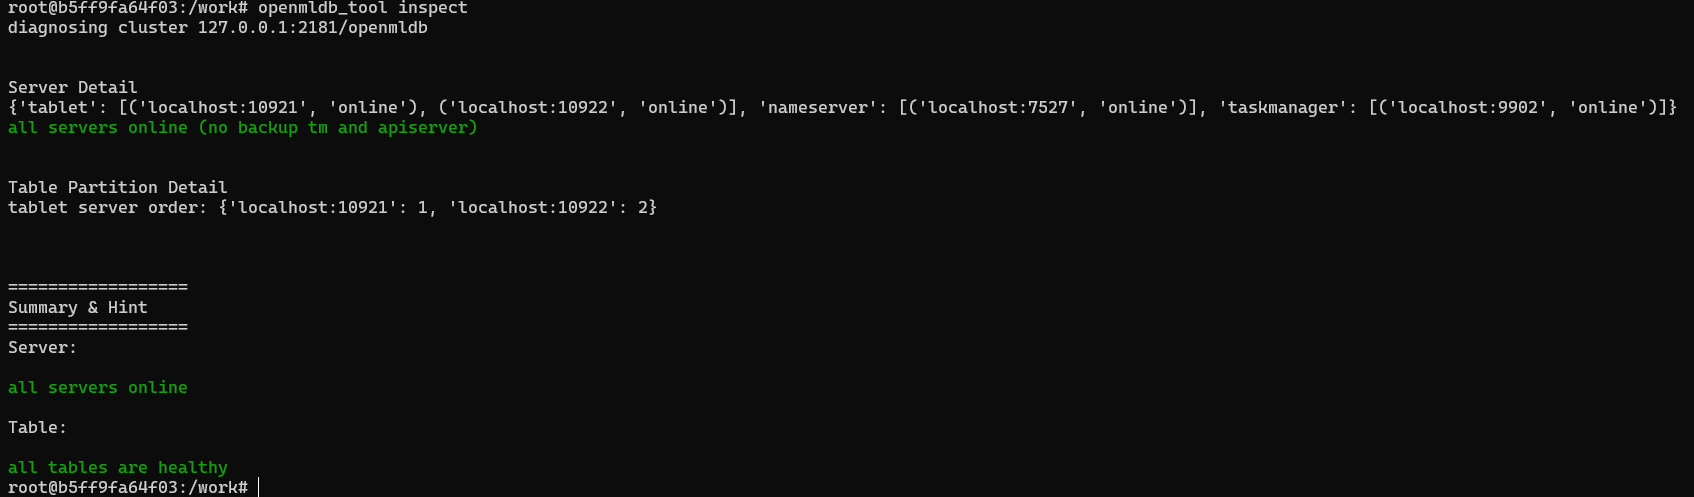
After performing a one-click diagnosis, users can directly inspect the Summary & Hint section towards the end of the report. This section summarizes the entire cluster's status, including the online status of servers and the health of tables.
Healthy Status
The green text indicates that all servers are online, and all tables are healthy, which is a normal state.
Abnormal Status
In the case of abnormal status, if a Tablet Server goes offline, the summary will indicate:
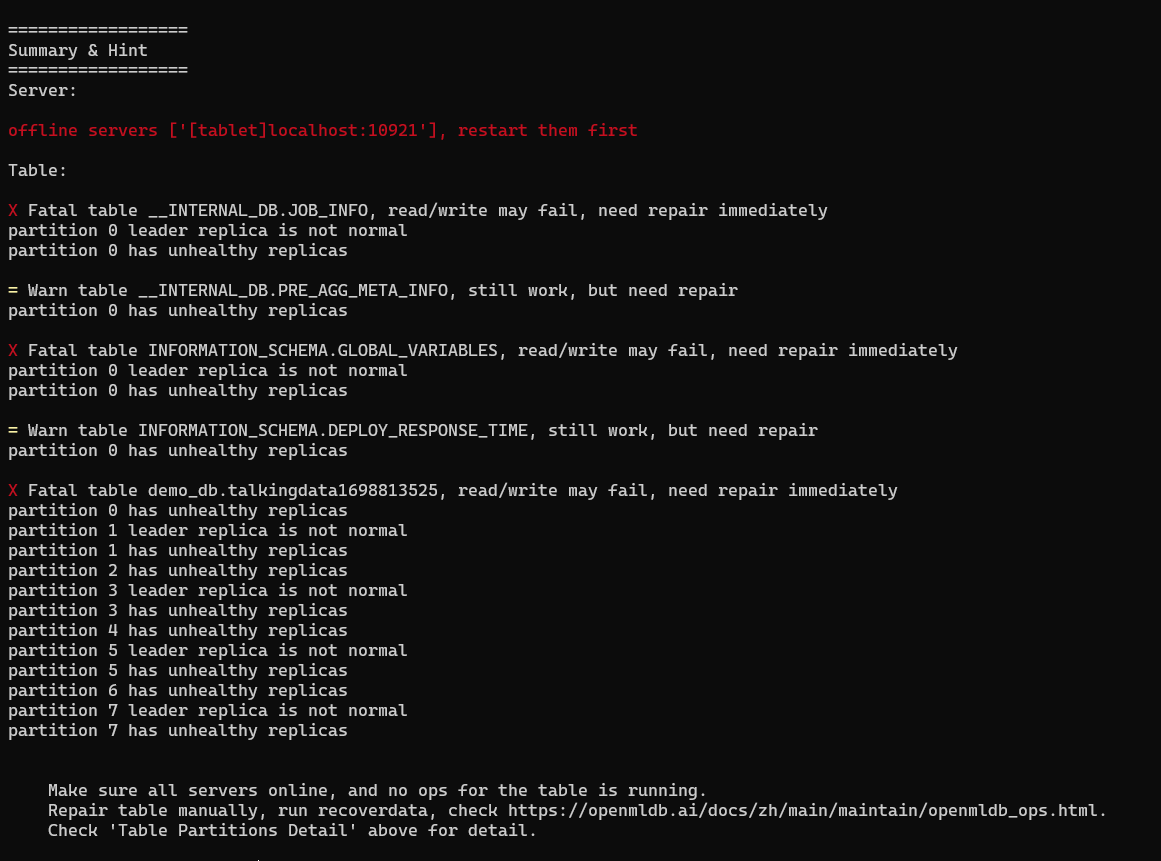
Server Abnormal Status
We can see "offline servers" in red, and the report suggests that we restart them. Unless the node has no data, in any other situation, prioritize the restoration of the offline server node before proceeding to diagnose the health status of the tables.
Abnormal Table Status
After restoring the offline servers and re-diagnosing the cluster, the report may be as shown in the following image. At this point, we can see that there are still unhealthy tables, exhibiting two types of statuses:
- X Red Fatal status indicates that the table is in a critical state, posing a risk of read and write failures, and requiring immediate attention.
- = Yellow Warn status indicates that the primary shards of the table are all active, allowing read and write operations, but it is still recommended to address this promptly. While it's not as critical as Fatal status, timely action is necessary.
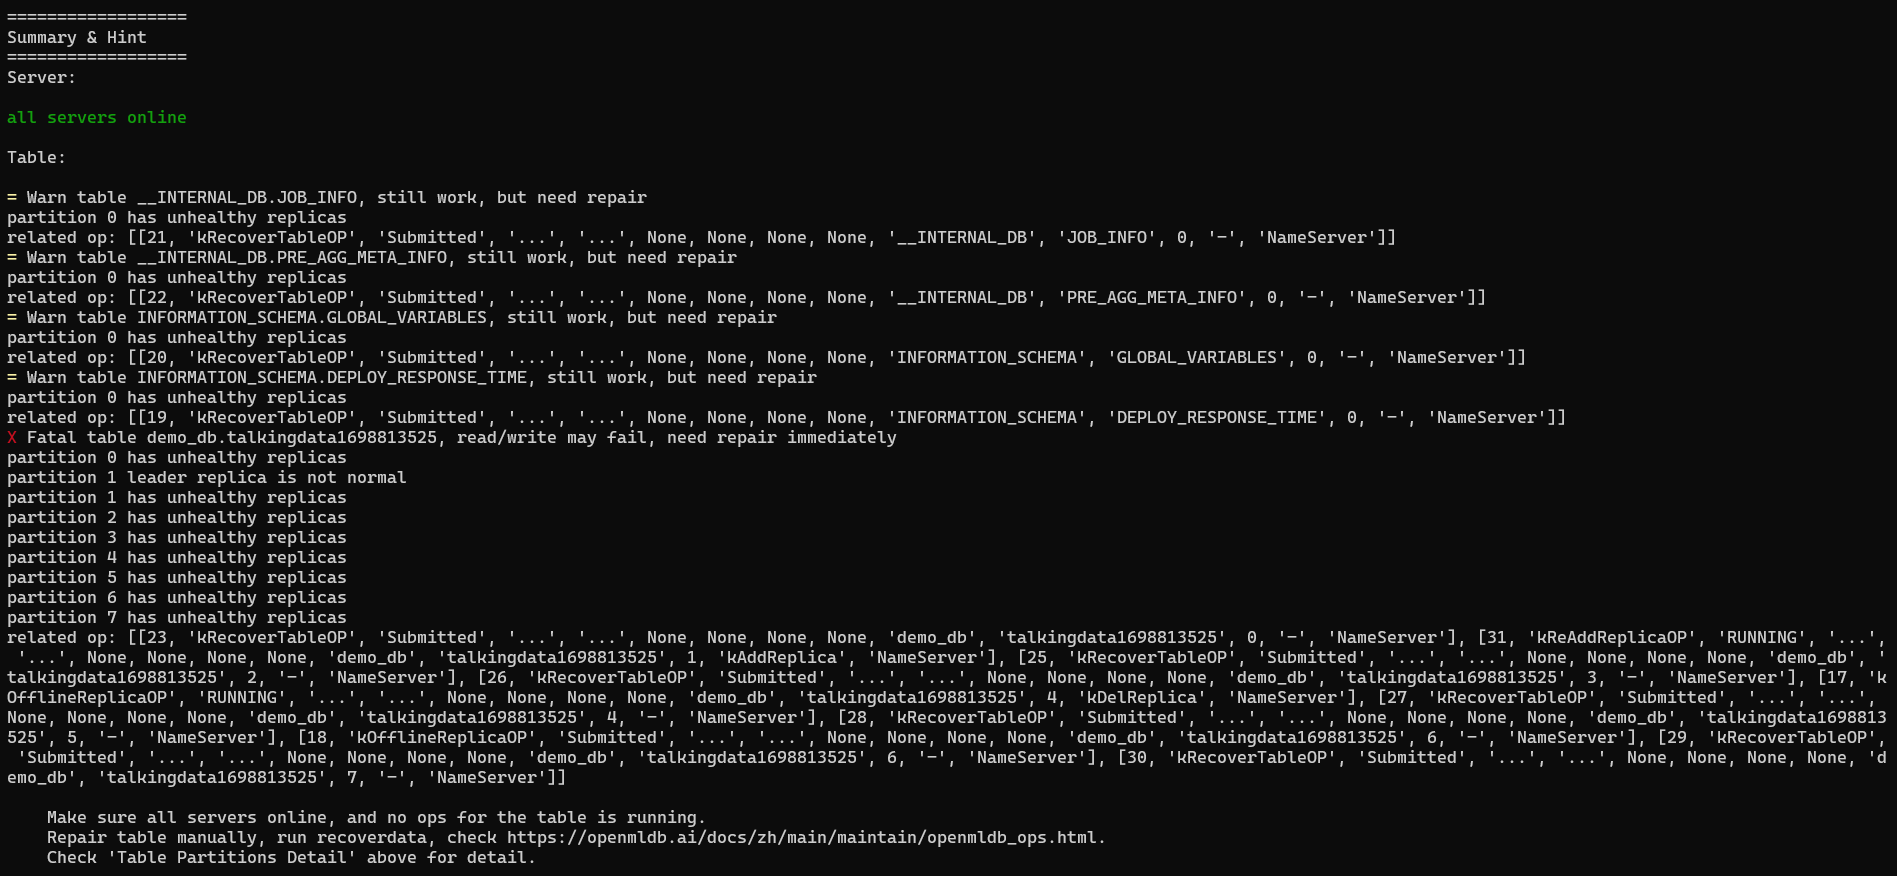
Please note that although these tables are still unhealthy, there are still associated background operations. These operations are repair processes initiated automatically by the cluster. At this point, manual intervention is not necessary, just wait for these background operations to complete.
Typically, after the automatic repairs by the cluster have finished, re-execution of one-click diagnosis will indicate that the cluster is now healthy.
Table Exceptional Status
During operational processes, there might be unforeseen circumstances leading to a scenario similar to the image below. The table is in an exceptional state, and there are no ongoing background operations. This signifies that the cluster hasn't initiated automatic repairs or that the repair process has failed.
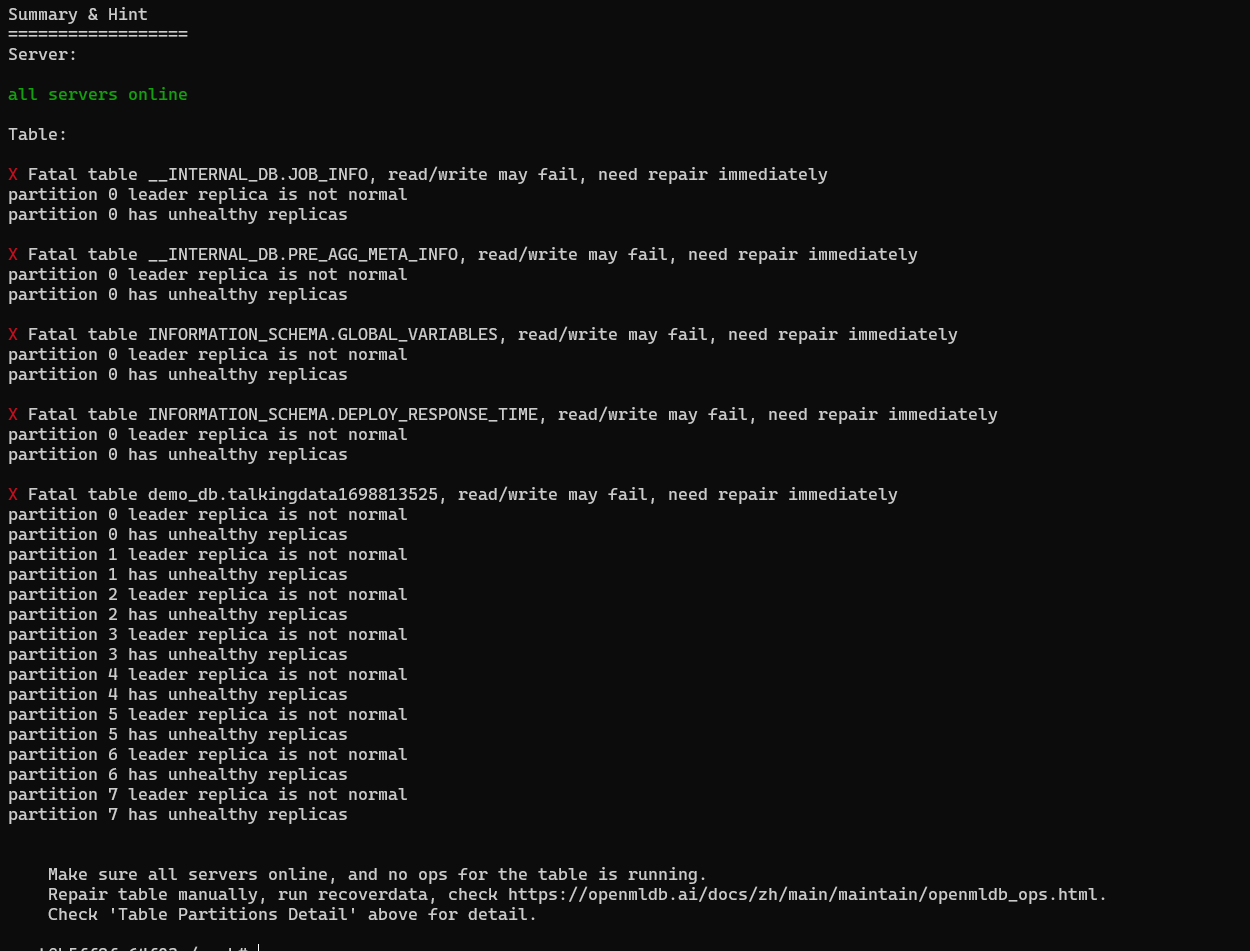
At this point, manual intervention is required from the user. Based on the guidance provided at the end of the report, the user needs to perform a "recoverdata" operation. If the "recoverdata" operation indicates success, the user can perform another one-click diagnosis to verify that the cluster has been restored to a healthy state.
Report Details
For more intricate situations, we can analyze the current cluster by referring to the XX Detail section in the report.
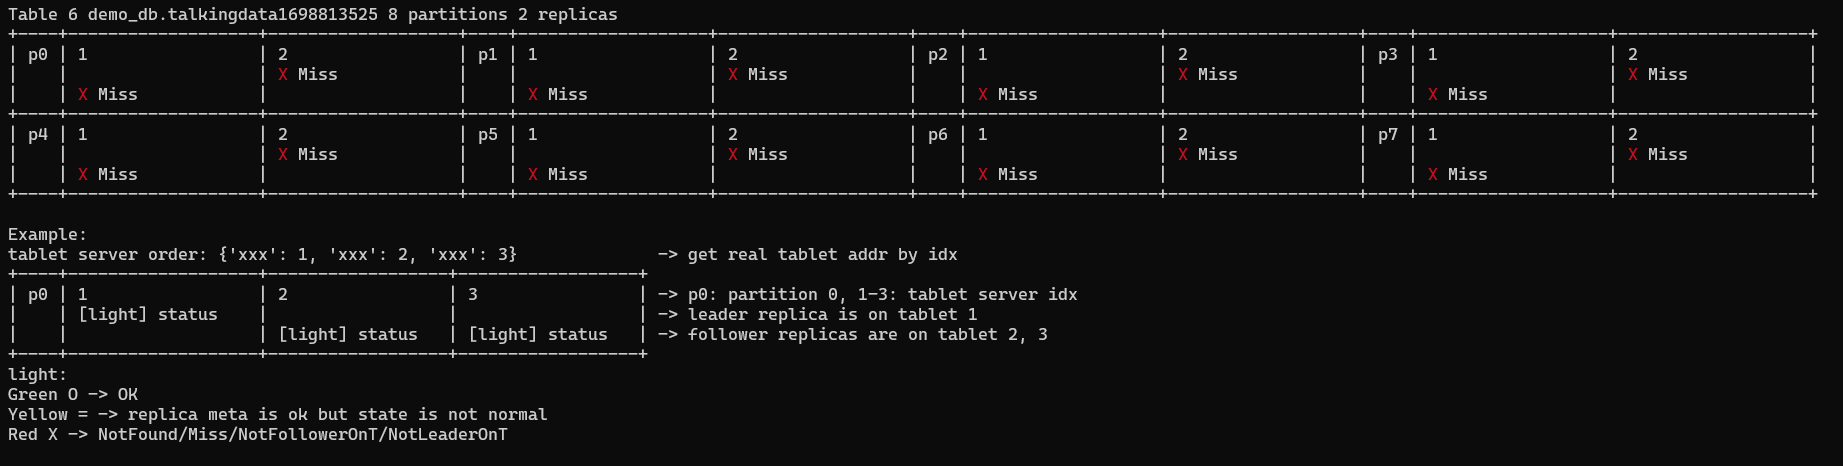
Table Partition Detail
The "Table Partition Detail" section provides an intuitive report of the current status of each partition within the tables. It displays clear information about where the primary and replica replicas of each partition are located on Tablet Servers and the state of each replica. As shown in the example, one can see the status of a partition, denoted as pX, including whether the metadata is missing or if there's an anomaly with the information on each Tablet Server.
Ops Detail
The "Ops Detail" section gives insights into the current background operations of the cluster, indicating whether automatic repairs have failed or if they are in progress. By observing the time of the last operation and the detailed status of the last ten operations that haven't been completed, you can determine if the cluster hasn't initiated automatic repairs, is currently undergoing repairs, has repair failures, or if specific tables have failed repair processes.
Report to Us
If you still can not resolve cluster issues through the aforementioned processes, you can share the report with us, and we will help to identify cluster problems and provide guidance for repair.
For more information on OpenMLDB:
- Official website: https://openmldb.ai/
- GitHub: https://github.com/4paradigm/OpenMLDB
- Documentation: https://openmldb.ai/docs/en/
- Join us on Slack !